
Analyzing Neighborhoods
ethanflynn.substack.com
Analyzing Neighborhoods
Here's a new property tool for you

Hey all - This is what I do on my sick days.
I’ve been working on a streamlined data tool that I use to quickly analyze neighborhoods. I find that plotting all transactions on a chart is uniquely useful because they tell a much more thorough story than median price.
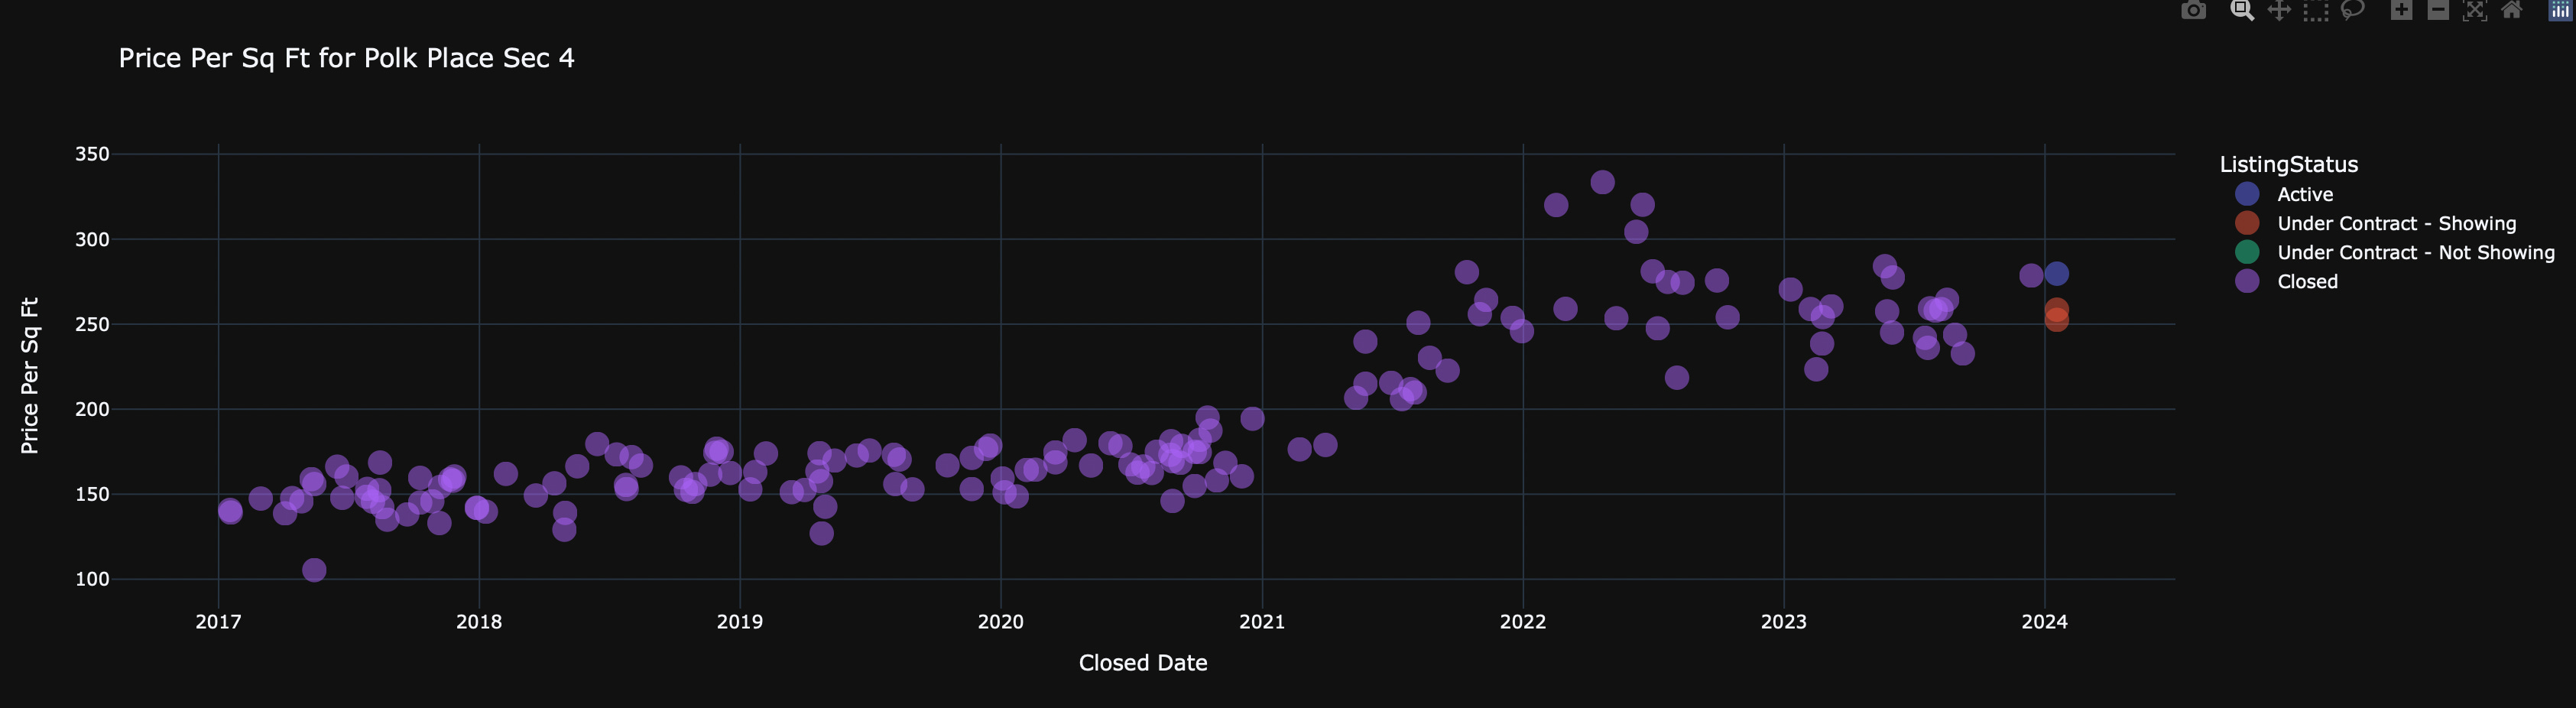
Then I view them by Property Type to see the difference in Townhouse vs SFH