In Nashville the housing market could not be more different depending on where and what type of property you are looking for. There are buyer’s markets across the street from seller’s markets.
I’m seeing a lot of people using Davidson County data to show that the housing market is weak here. The big problem with this is Davidson County is weak, but not the outer areas. Also, it’s hard to tell how much impact the snow storm had on this week’s housing market, but it will become apparent in the days to come, so stay tuned.
Hottest County: Wilson (Mount Juliet / Lebanon)
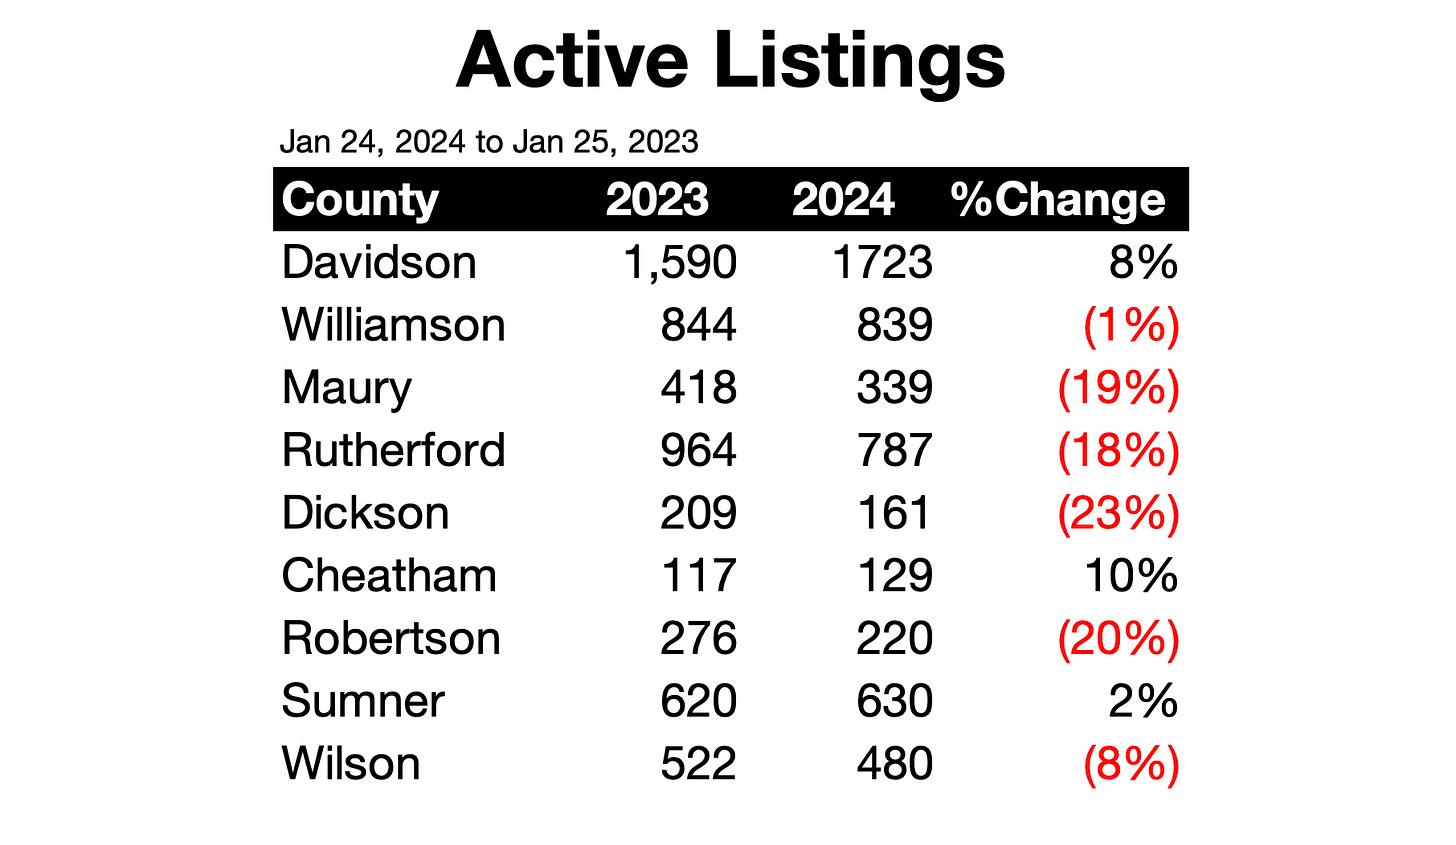
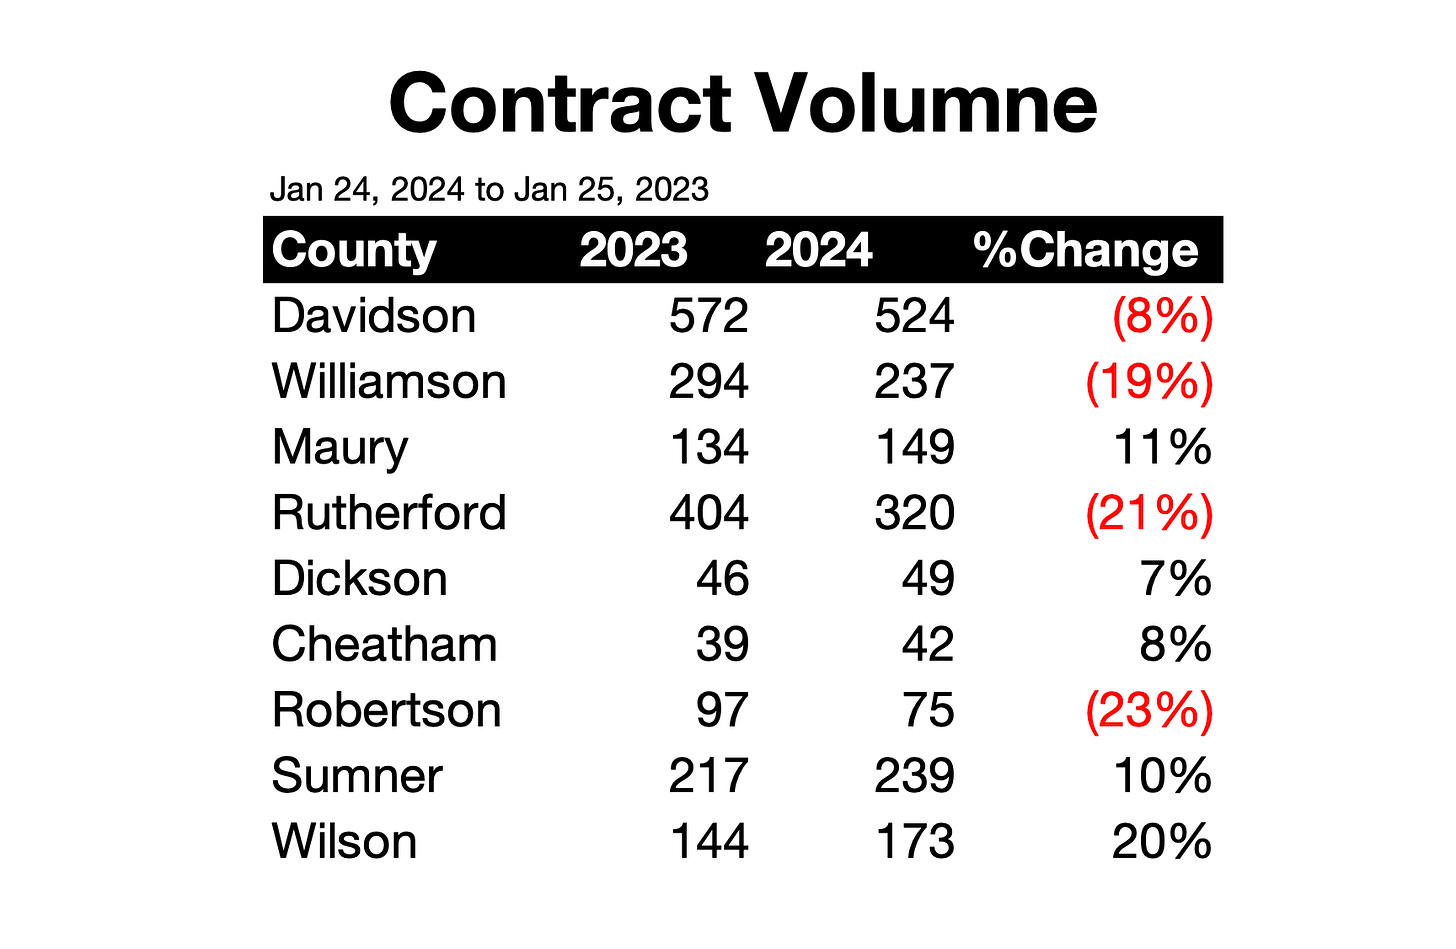
Wilson County is starting the year hot with contract volume up 20% yoy and active listings down 8%. This is leaving supply feeling like 2.77 months of inventory vs last year when it was 3.63.
Coldest County: Davidson (Nashville Core)
Davidson County is starting the year very slow with contract volume down 8% yoy and active listings up 8%. This is making supply feeling like 3.29 months of inventory vs last year when it was 2.78. This is bad news as Davidson is also taking the brunt of the CRE crash and influx of Luxury Apartments.
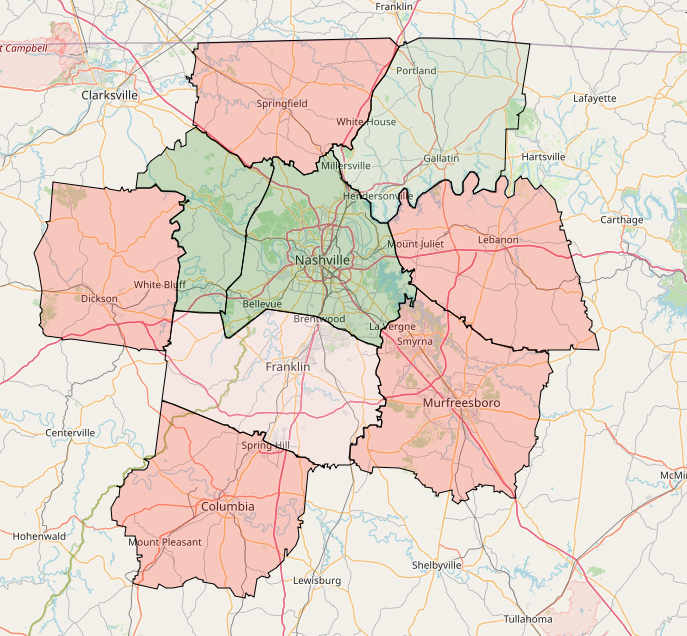
Active Listings YoY
(red = good for sellers, green = good for buyers)
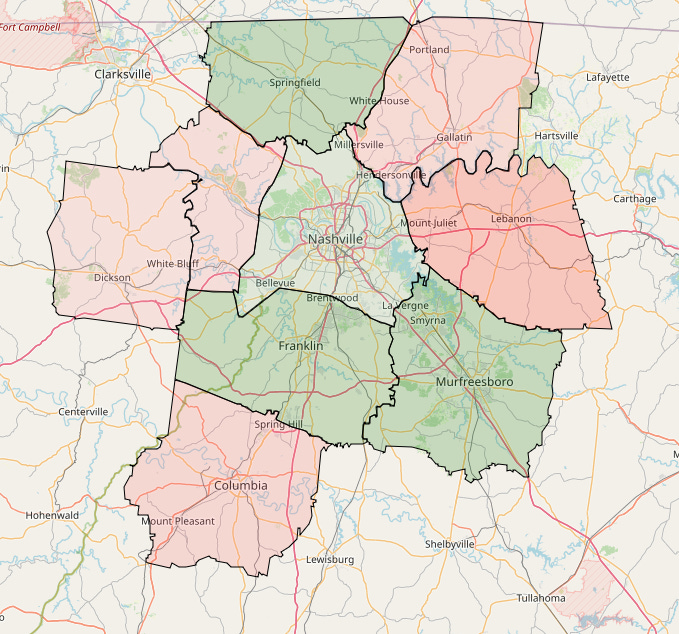
Contract Volume YoY
(red = good for sellers, green = good for buyers)
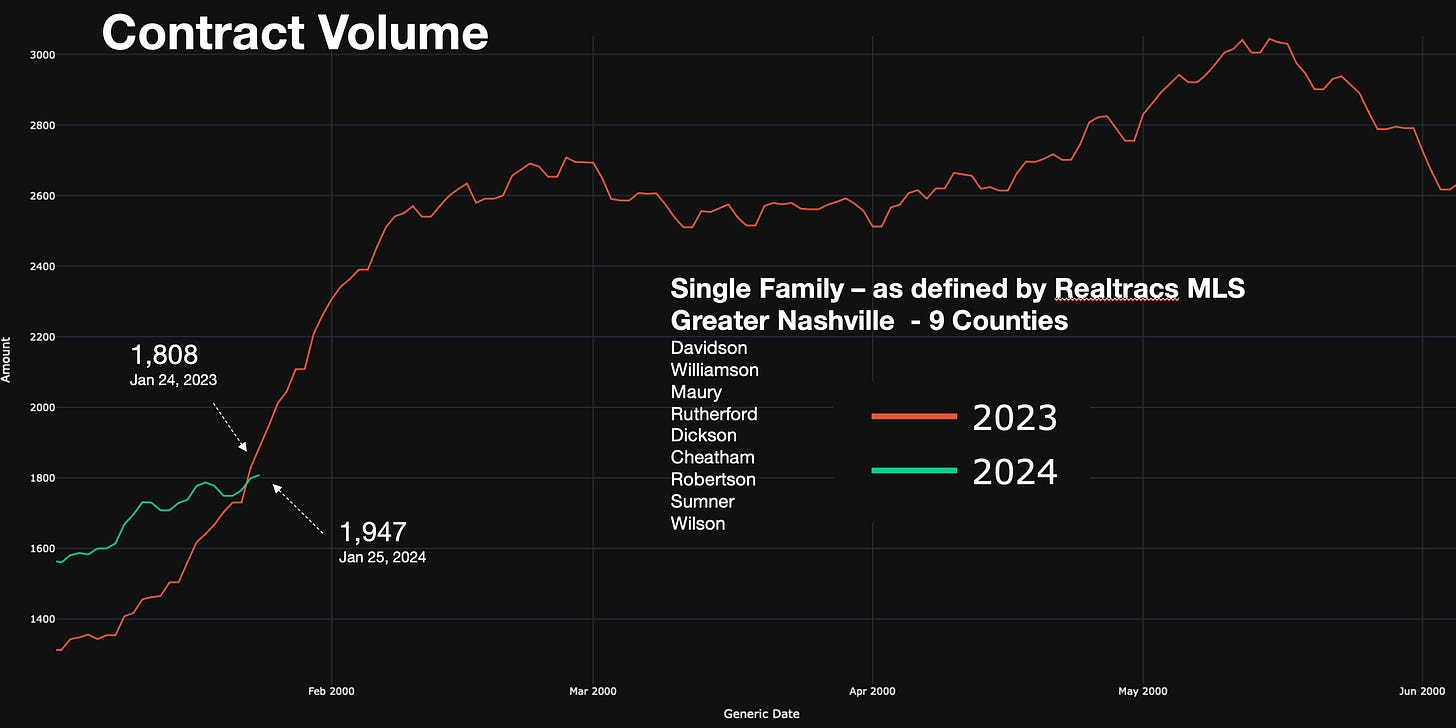
Greater Nashville Contract Volume
Here’s a view for greater Nashville. Contract Volume down ~8% YoY. Hard to tell what’s noise from the weather and what is the real story on the market momentum. We will find out shortly.
Thanks for reading!


