Nashville $1M Listing Deep Dive
ethanflynn.substack.com
Nashville $1M Listing Deep Dive
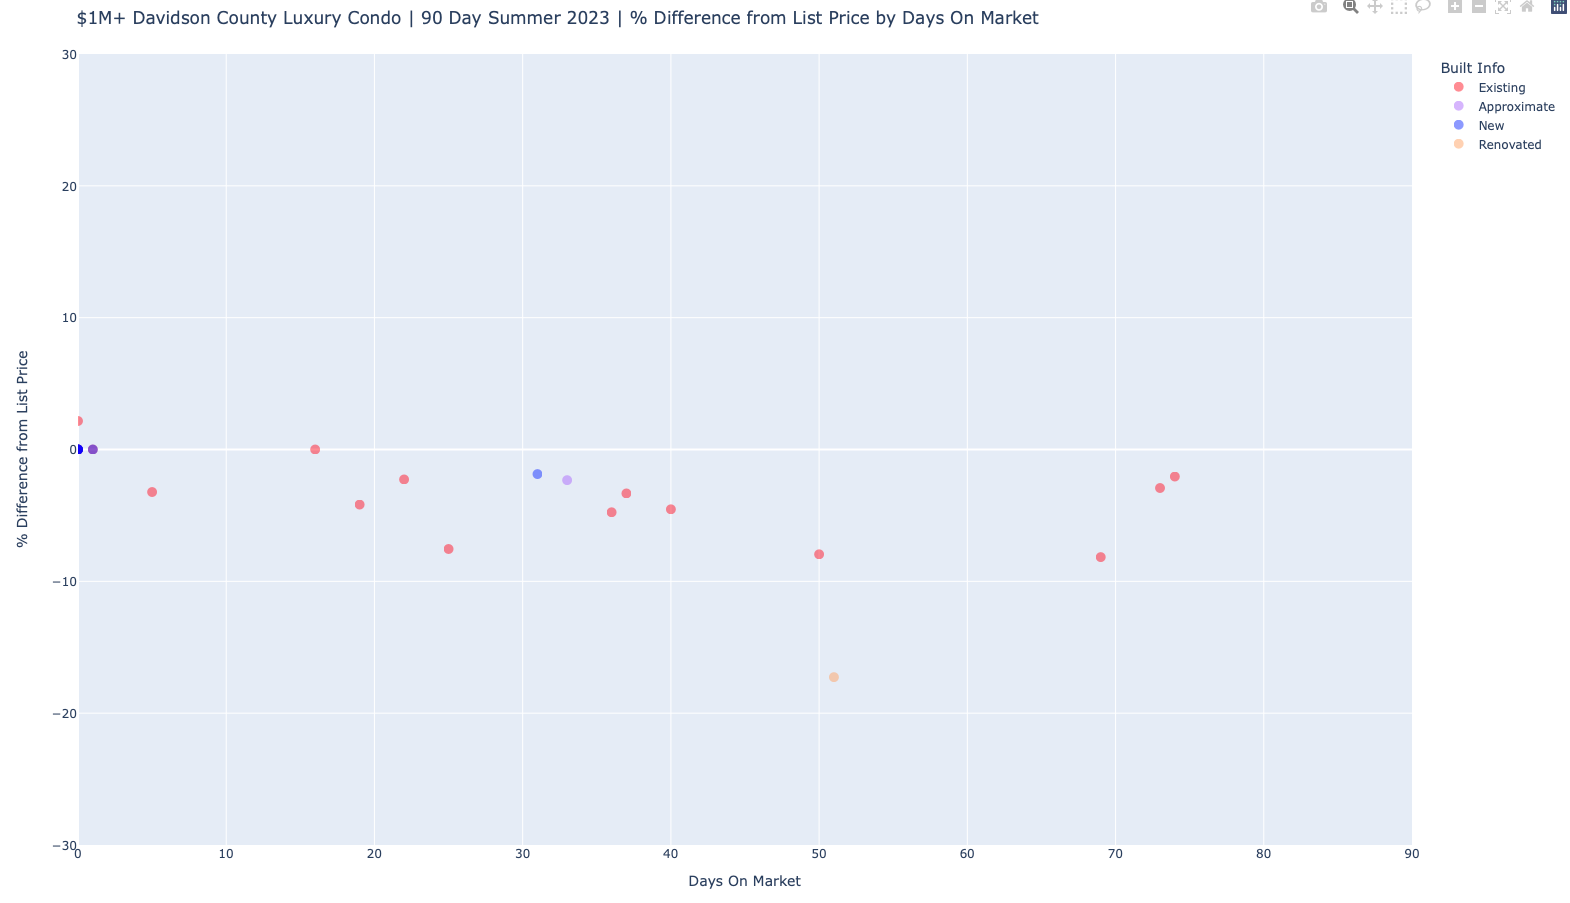
Inventory | Discounts | Days on Market

Below are the HTML charts and graphs used for the video today. The links for the interactive HTMLs are available at bottom for PAID subscribers. Thanks for watching!
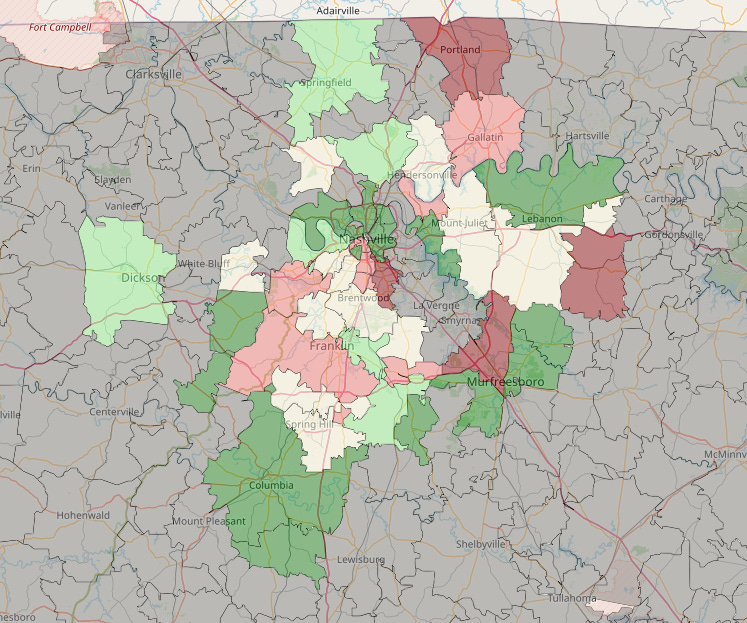
Here’s the map of $1M listing inventory relative to contract volume in that zipcode.
Red < 3 Months
Light Red <4 Months
White 4-6 Months
Light Green 7 - 10
Dark Green > 10 Months