
Some cold hard stats about Nashville Housing
Some cold hard stats about Nashville Housing
If you think Nashville is crashing

You all know that I’m super bearish on home prices as the rents don’t justify most of the home values out there. I would be happy to see Nashville prices come back to reality by historical median payment to income ranges. That being said, Nashville is NOT crashing. In fact, there’s momentum going into the spring. So with that, I want to provide a data rebuttal for some recent bearish stats suggesting inventory is up and sales are down.
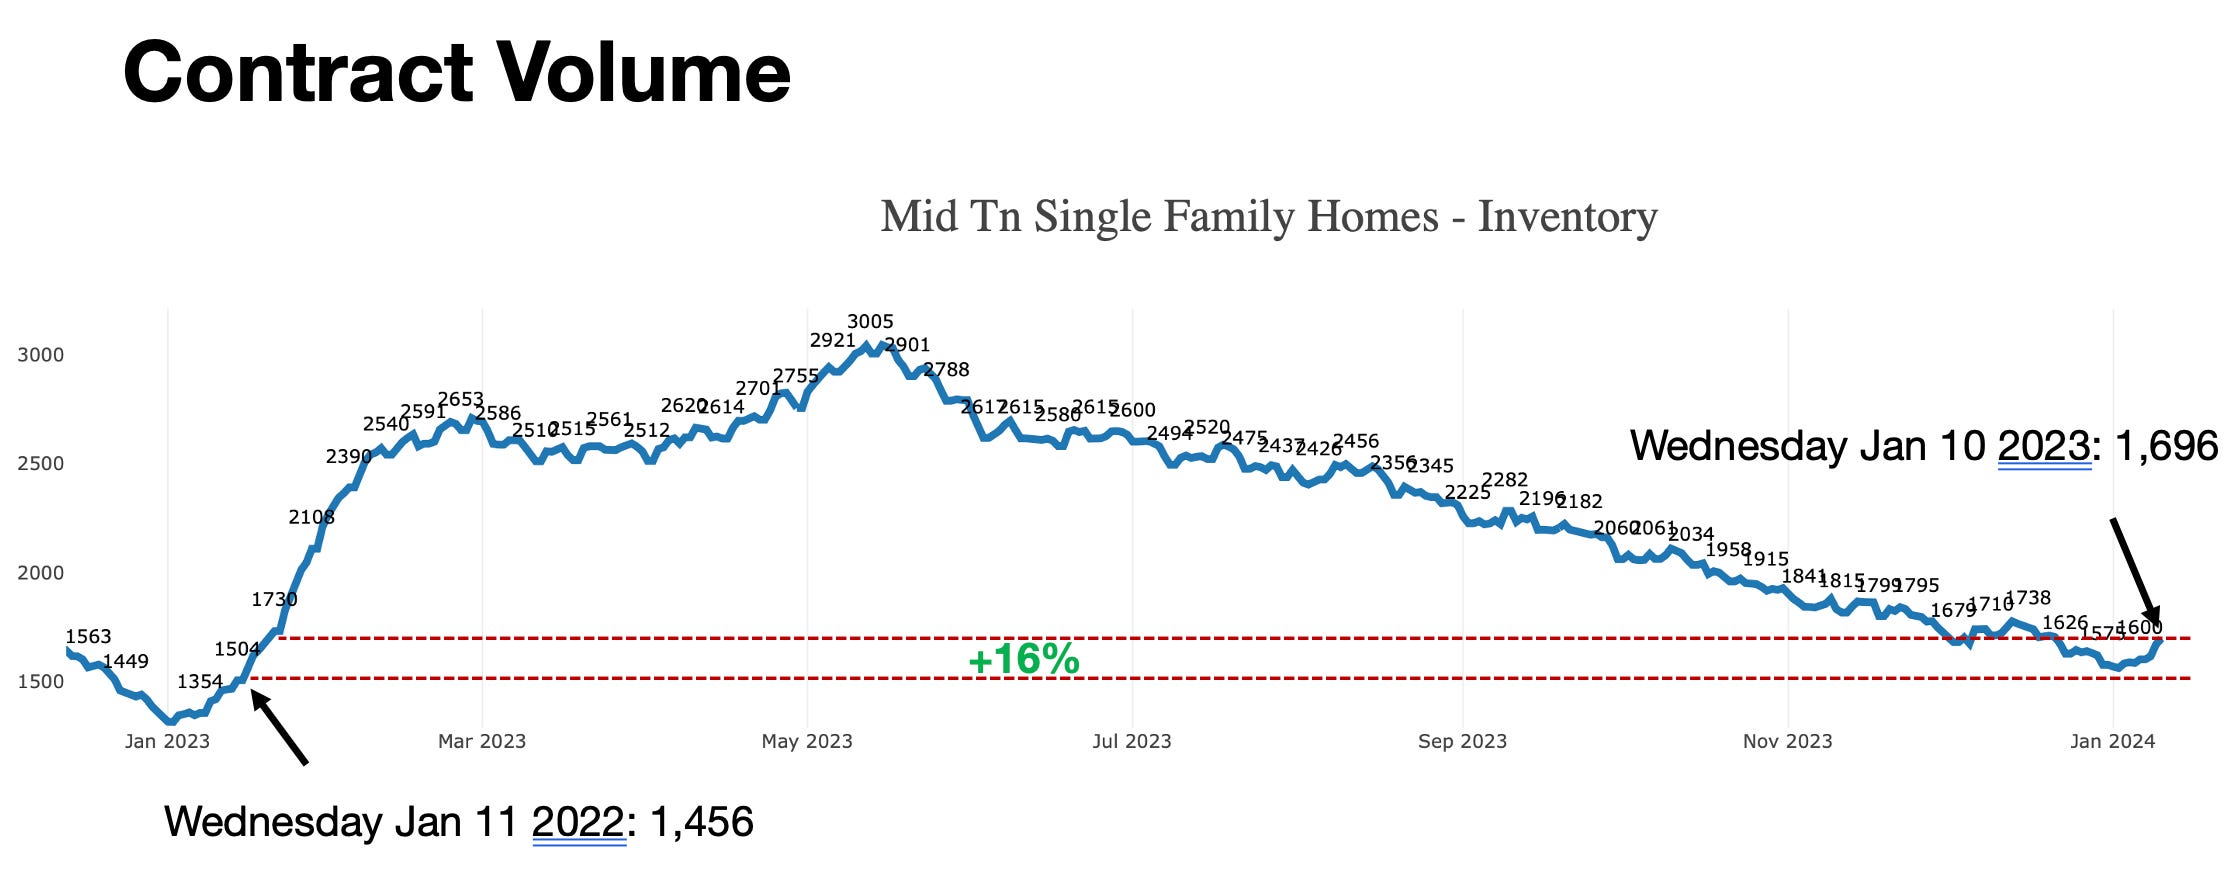
Contract Volume is UP 16% YoY
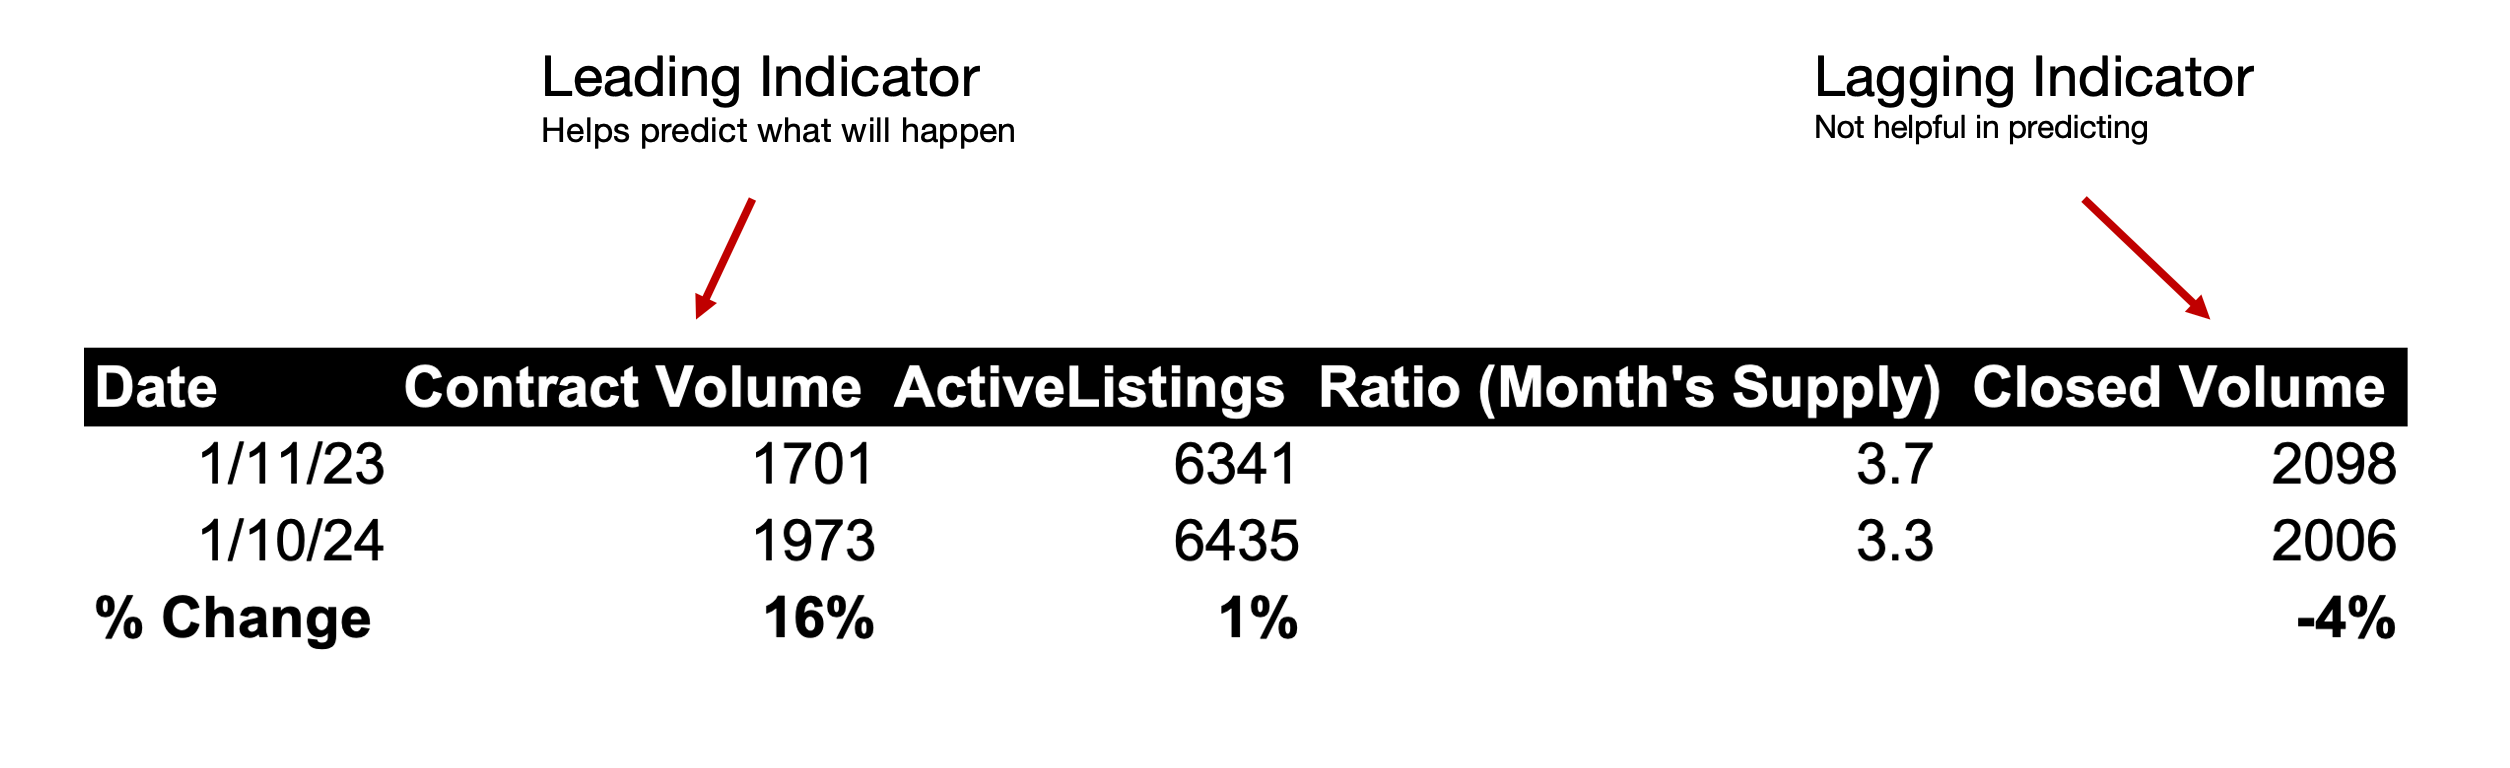
In the greater Nashville area contract volume is UP 16% YoY for Single Family Homes. Every day, I literally count the MLS contracts from the past 31 days. It’s up. That means closed volume will soon be up too. What matters most right now is will it continue past the early spring peak of 2,653? If so we will have higher close volume through the first quarter and possibly through June. Contract volume is a leading indicator of closed volume.
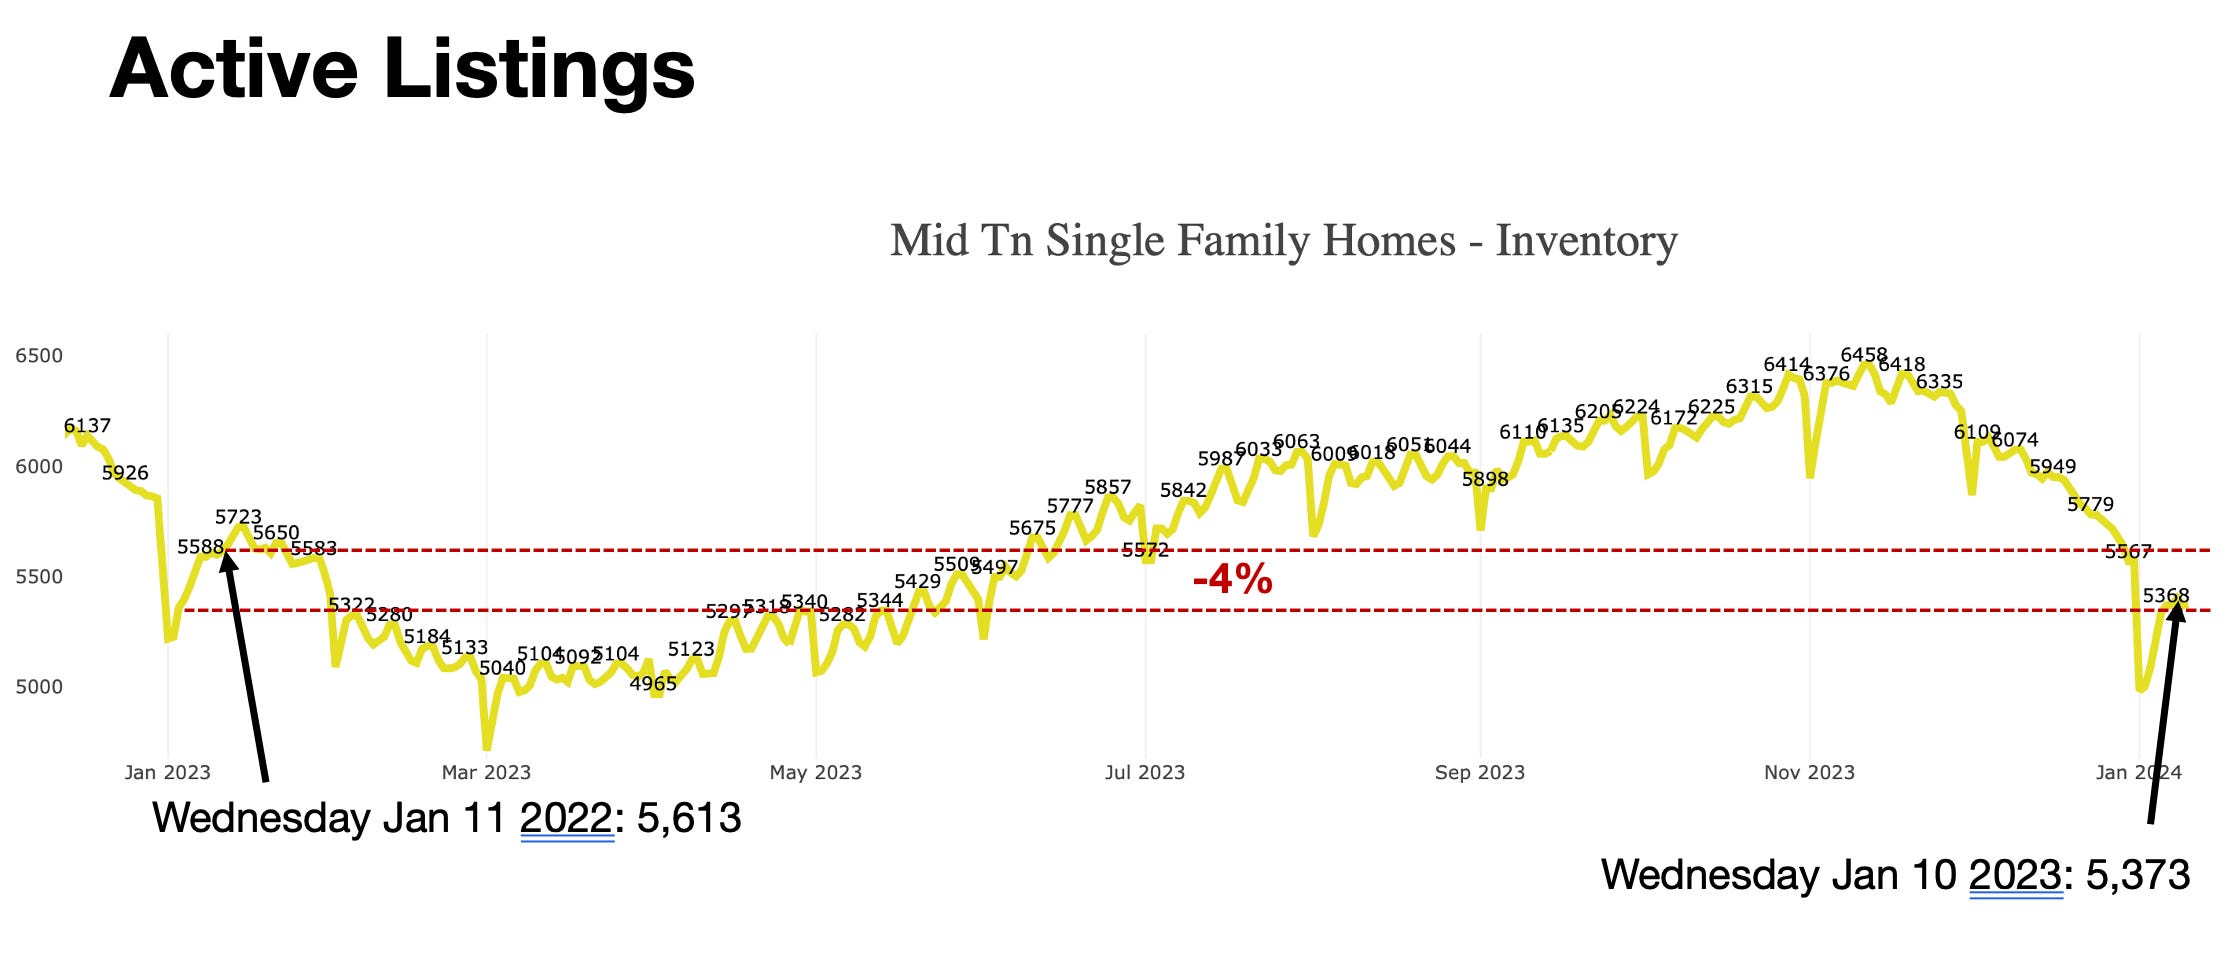
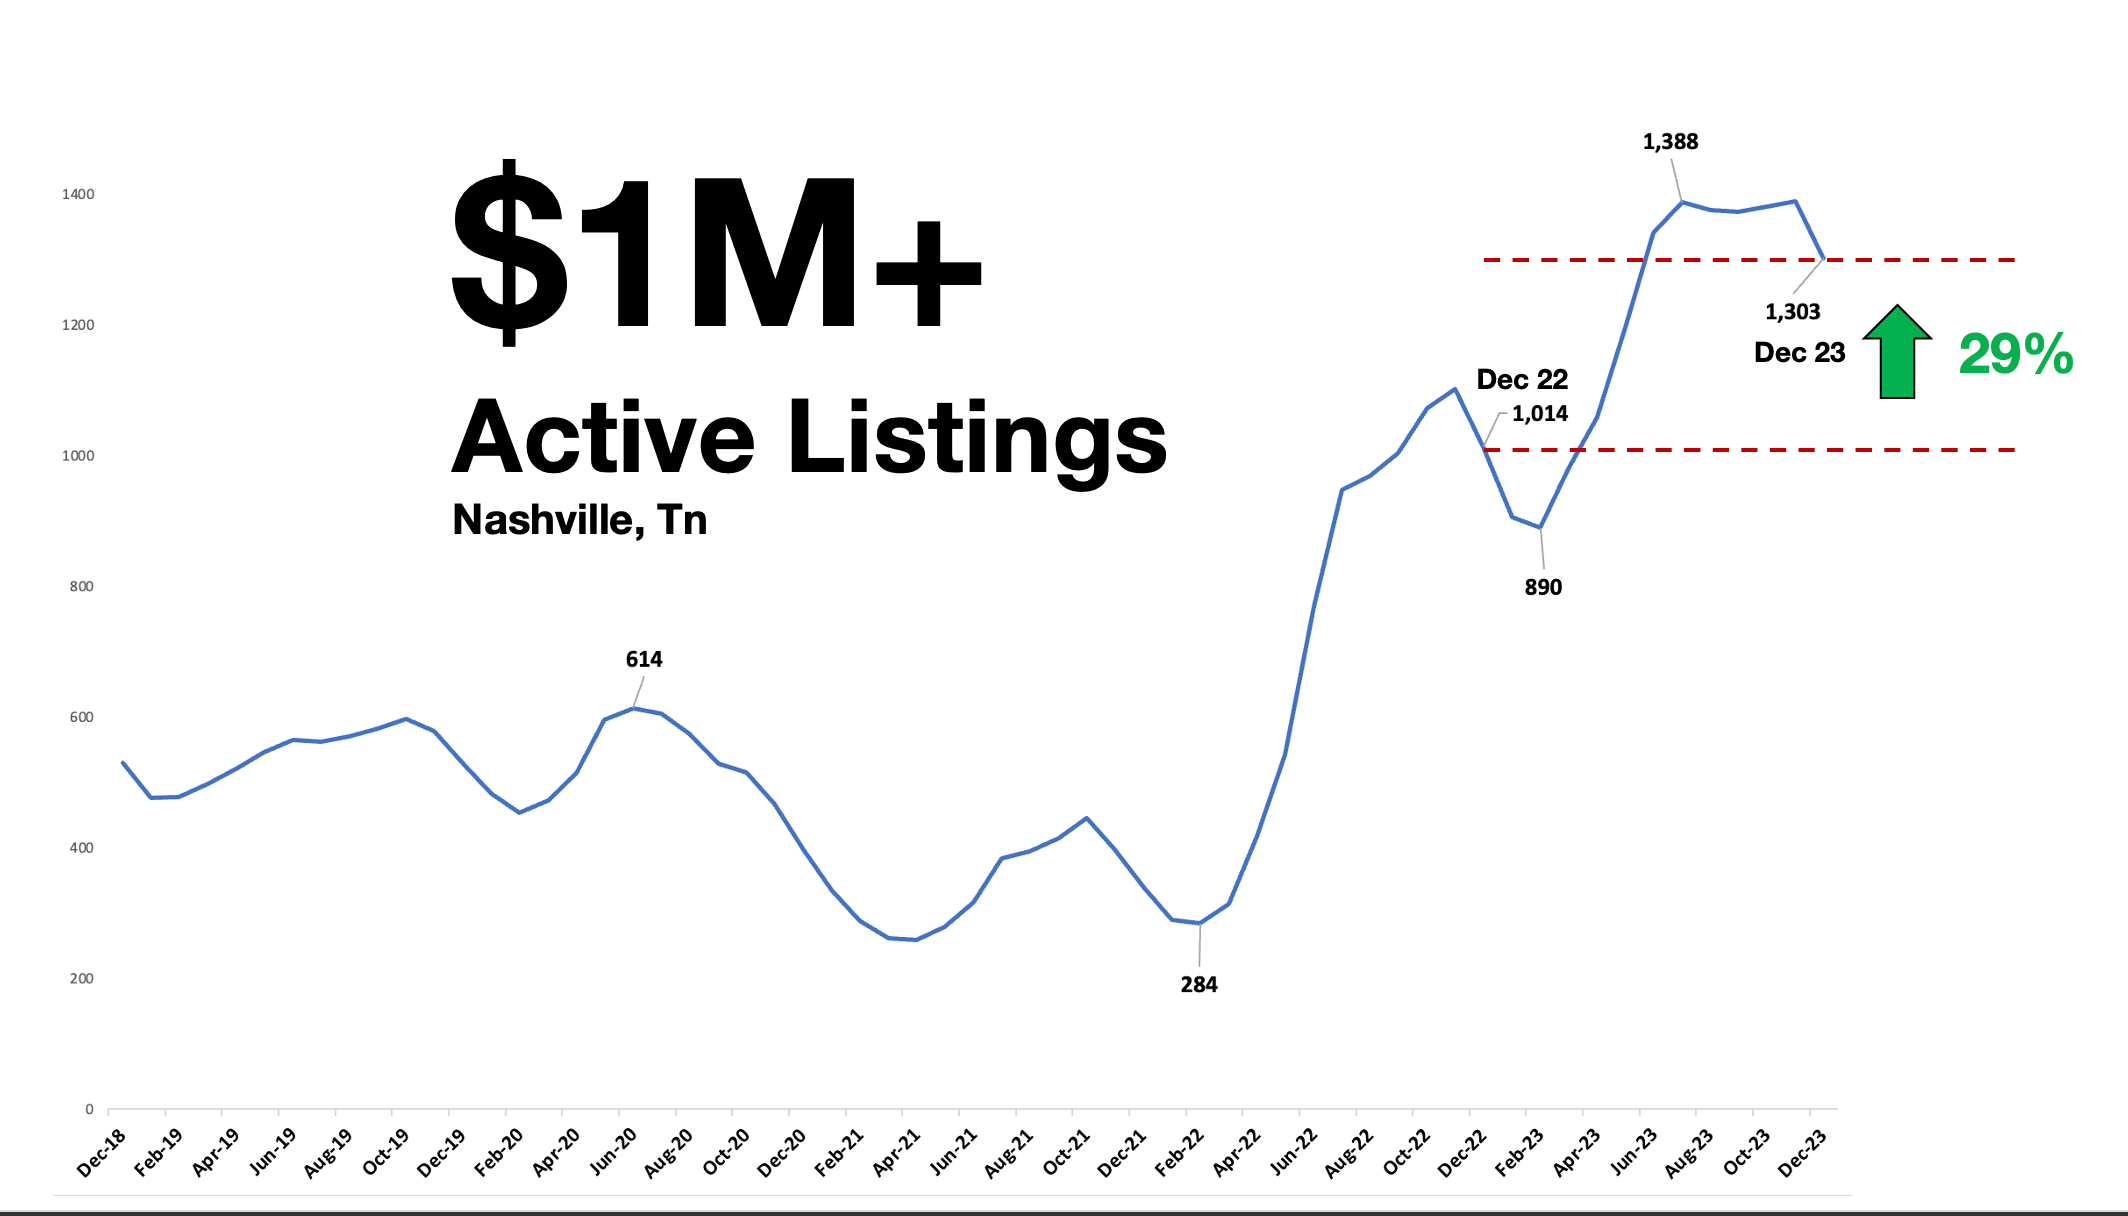
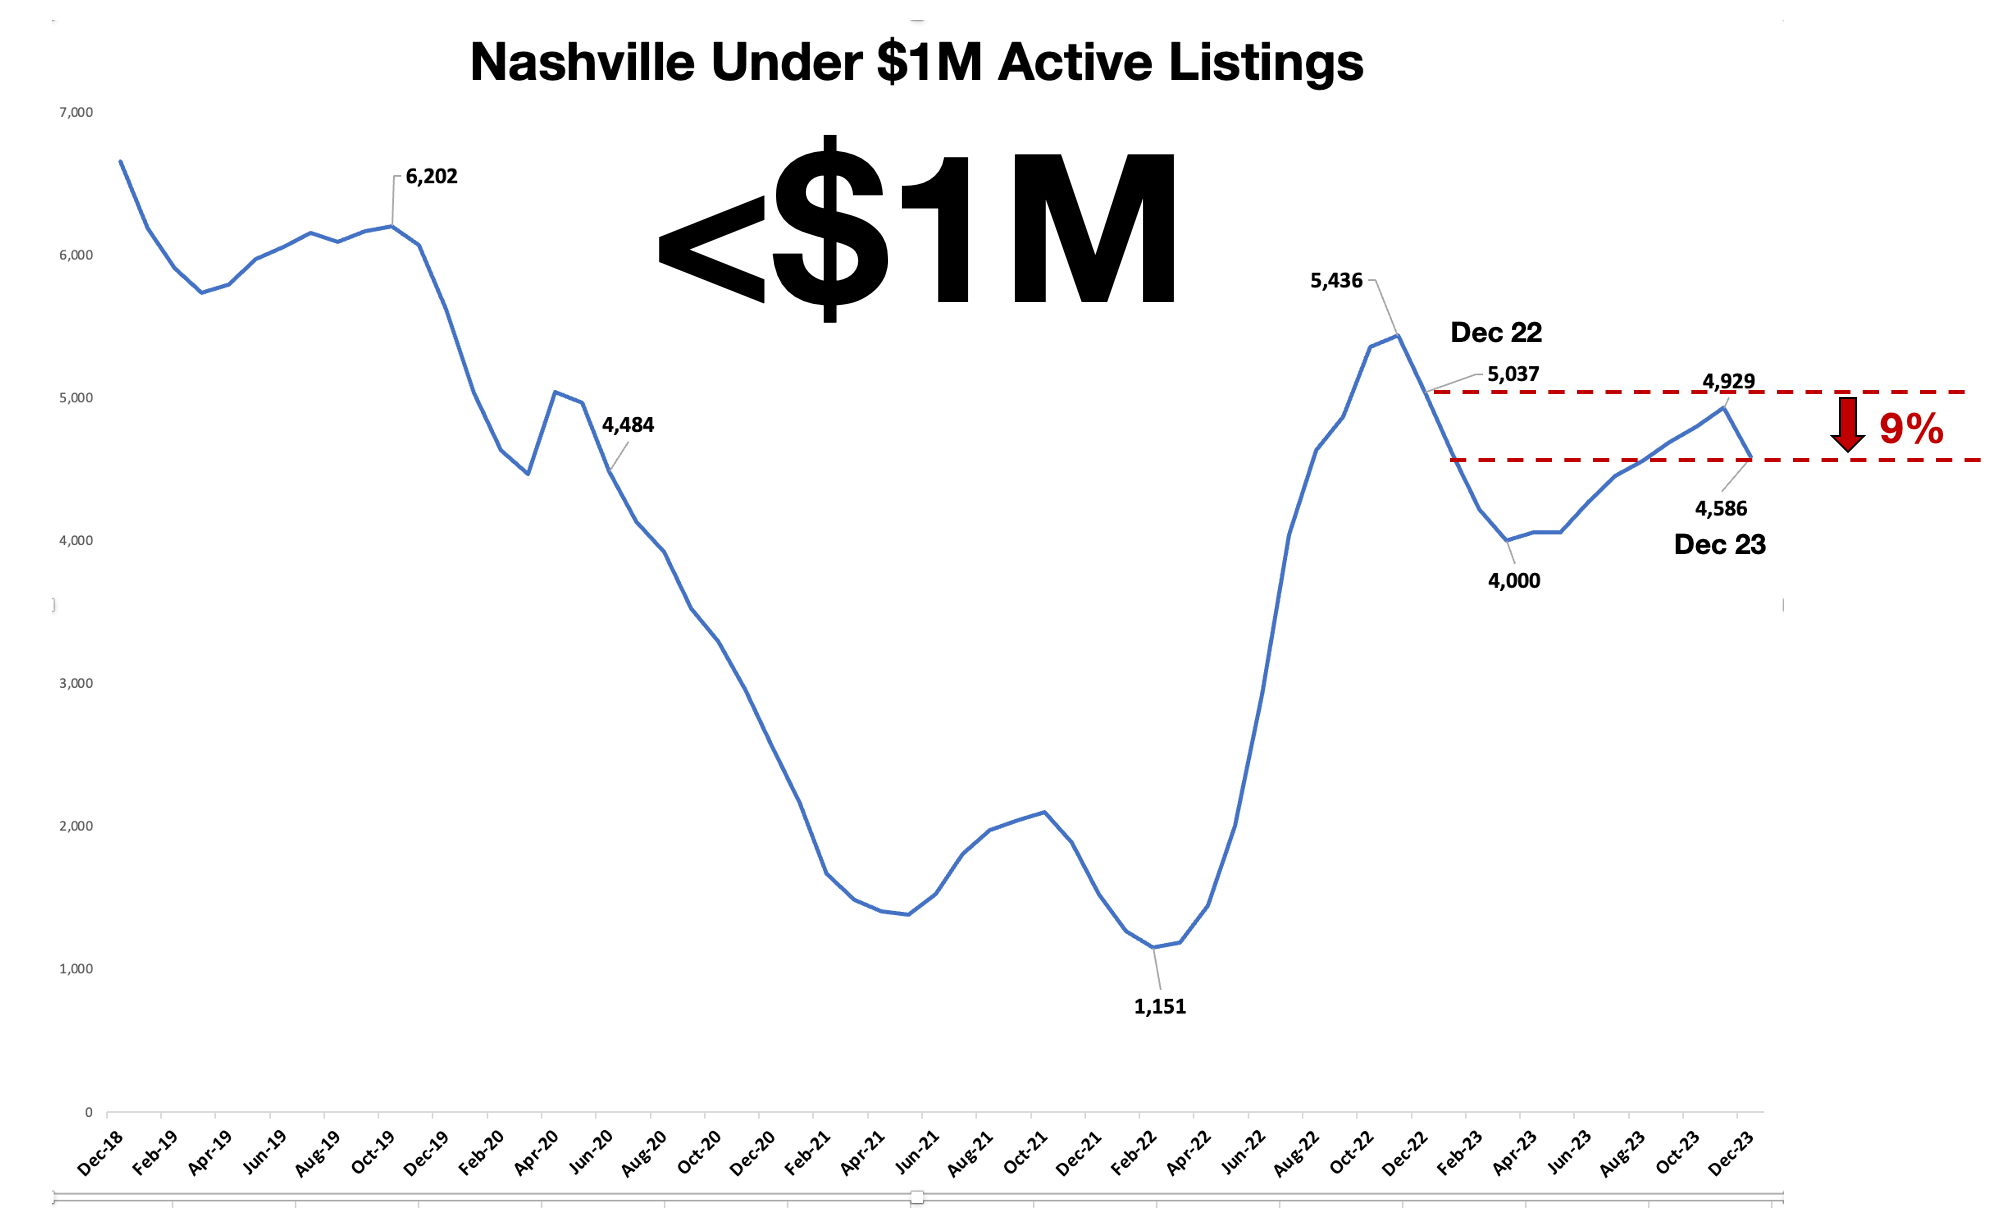
Active listings are down 4%
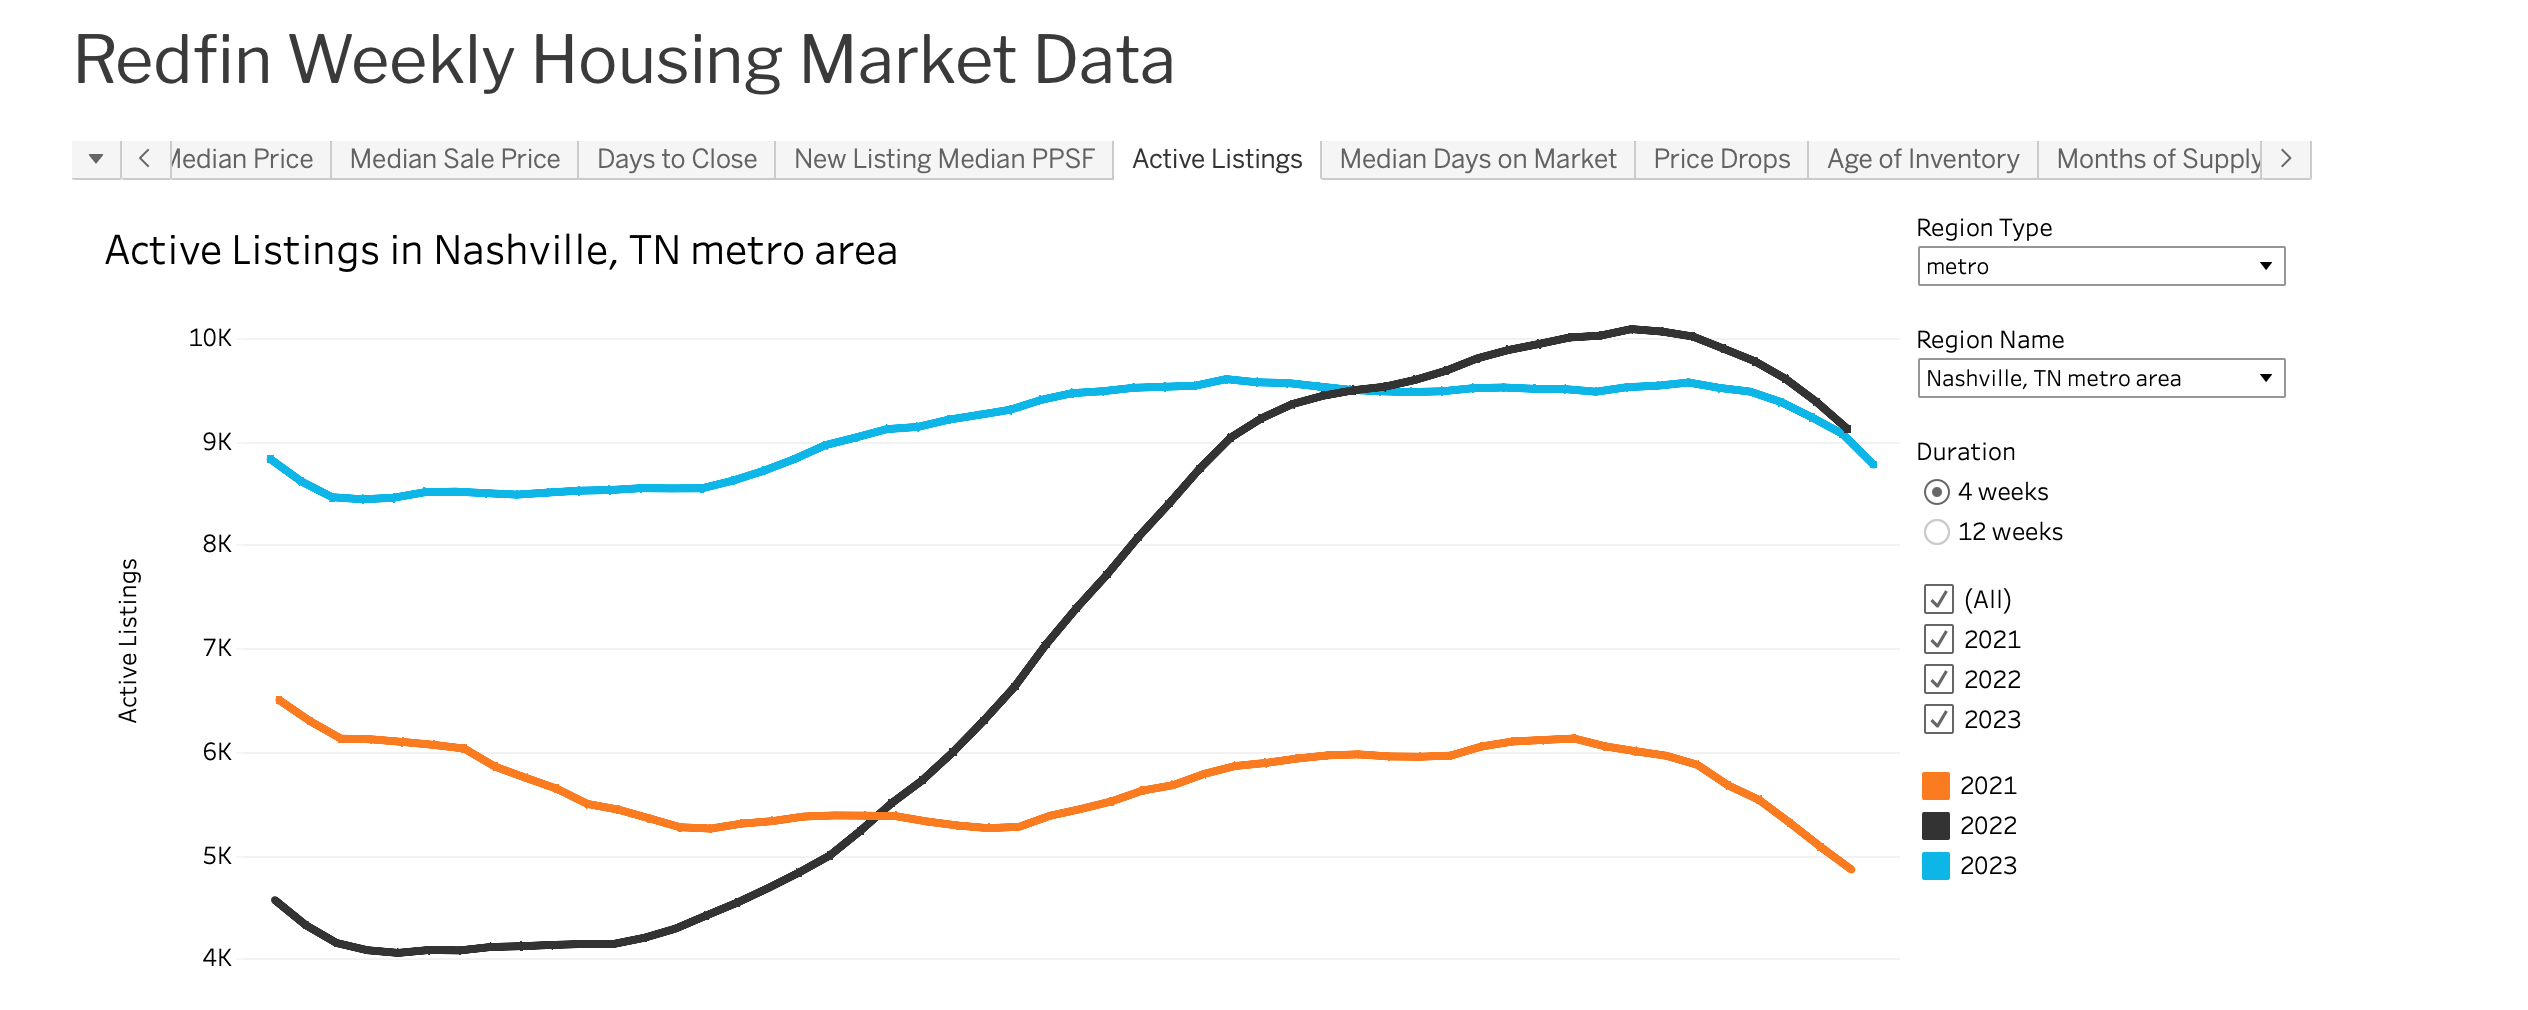
Active listings are down 4% and if you look at the pricing mix it’s much worse as there has been a 30% increase in $1M+ listings while the supply of lower priced housing is still shrinking in many areas.
Even Redfin is showing Active listings down.
Why are there reports inventory is up?
So why are we seeing postings that Nashville inventory is up?


These reports are being sourced from Realtor.com and the primary driver for the difference is Condos.
Condos are included in their count and condo listings are up 30%
880 - Dec 2022
1,172 - Dec 2023
There are some other small differences: I count Coming Soon - Hold, Realtor.com wouldn’t. My methodology is focused on how I see the Buyer experience.
Where are we today if Condos are included?
As of 1/10/24 If condos are included, inventory is up 1% and Contract Volume is up 16%. That means, inventory is still tighter relative to the number of buyers going under contract but if you use close volume, it would look like there’s more supply. This is why I avoid using closed volume; it’s a lagging indicator of what has already happened. Not forward looking.
And since contracts are increasing it also means all of those figures showing declining sales are soon to be showing growth.
Reports that Closed Volume is down 15%
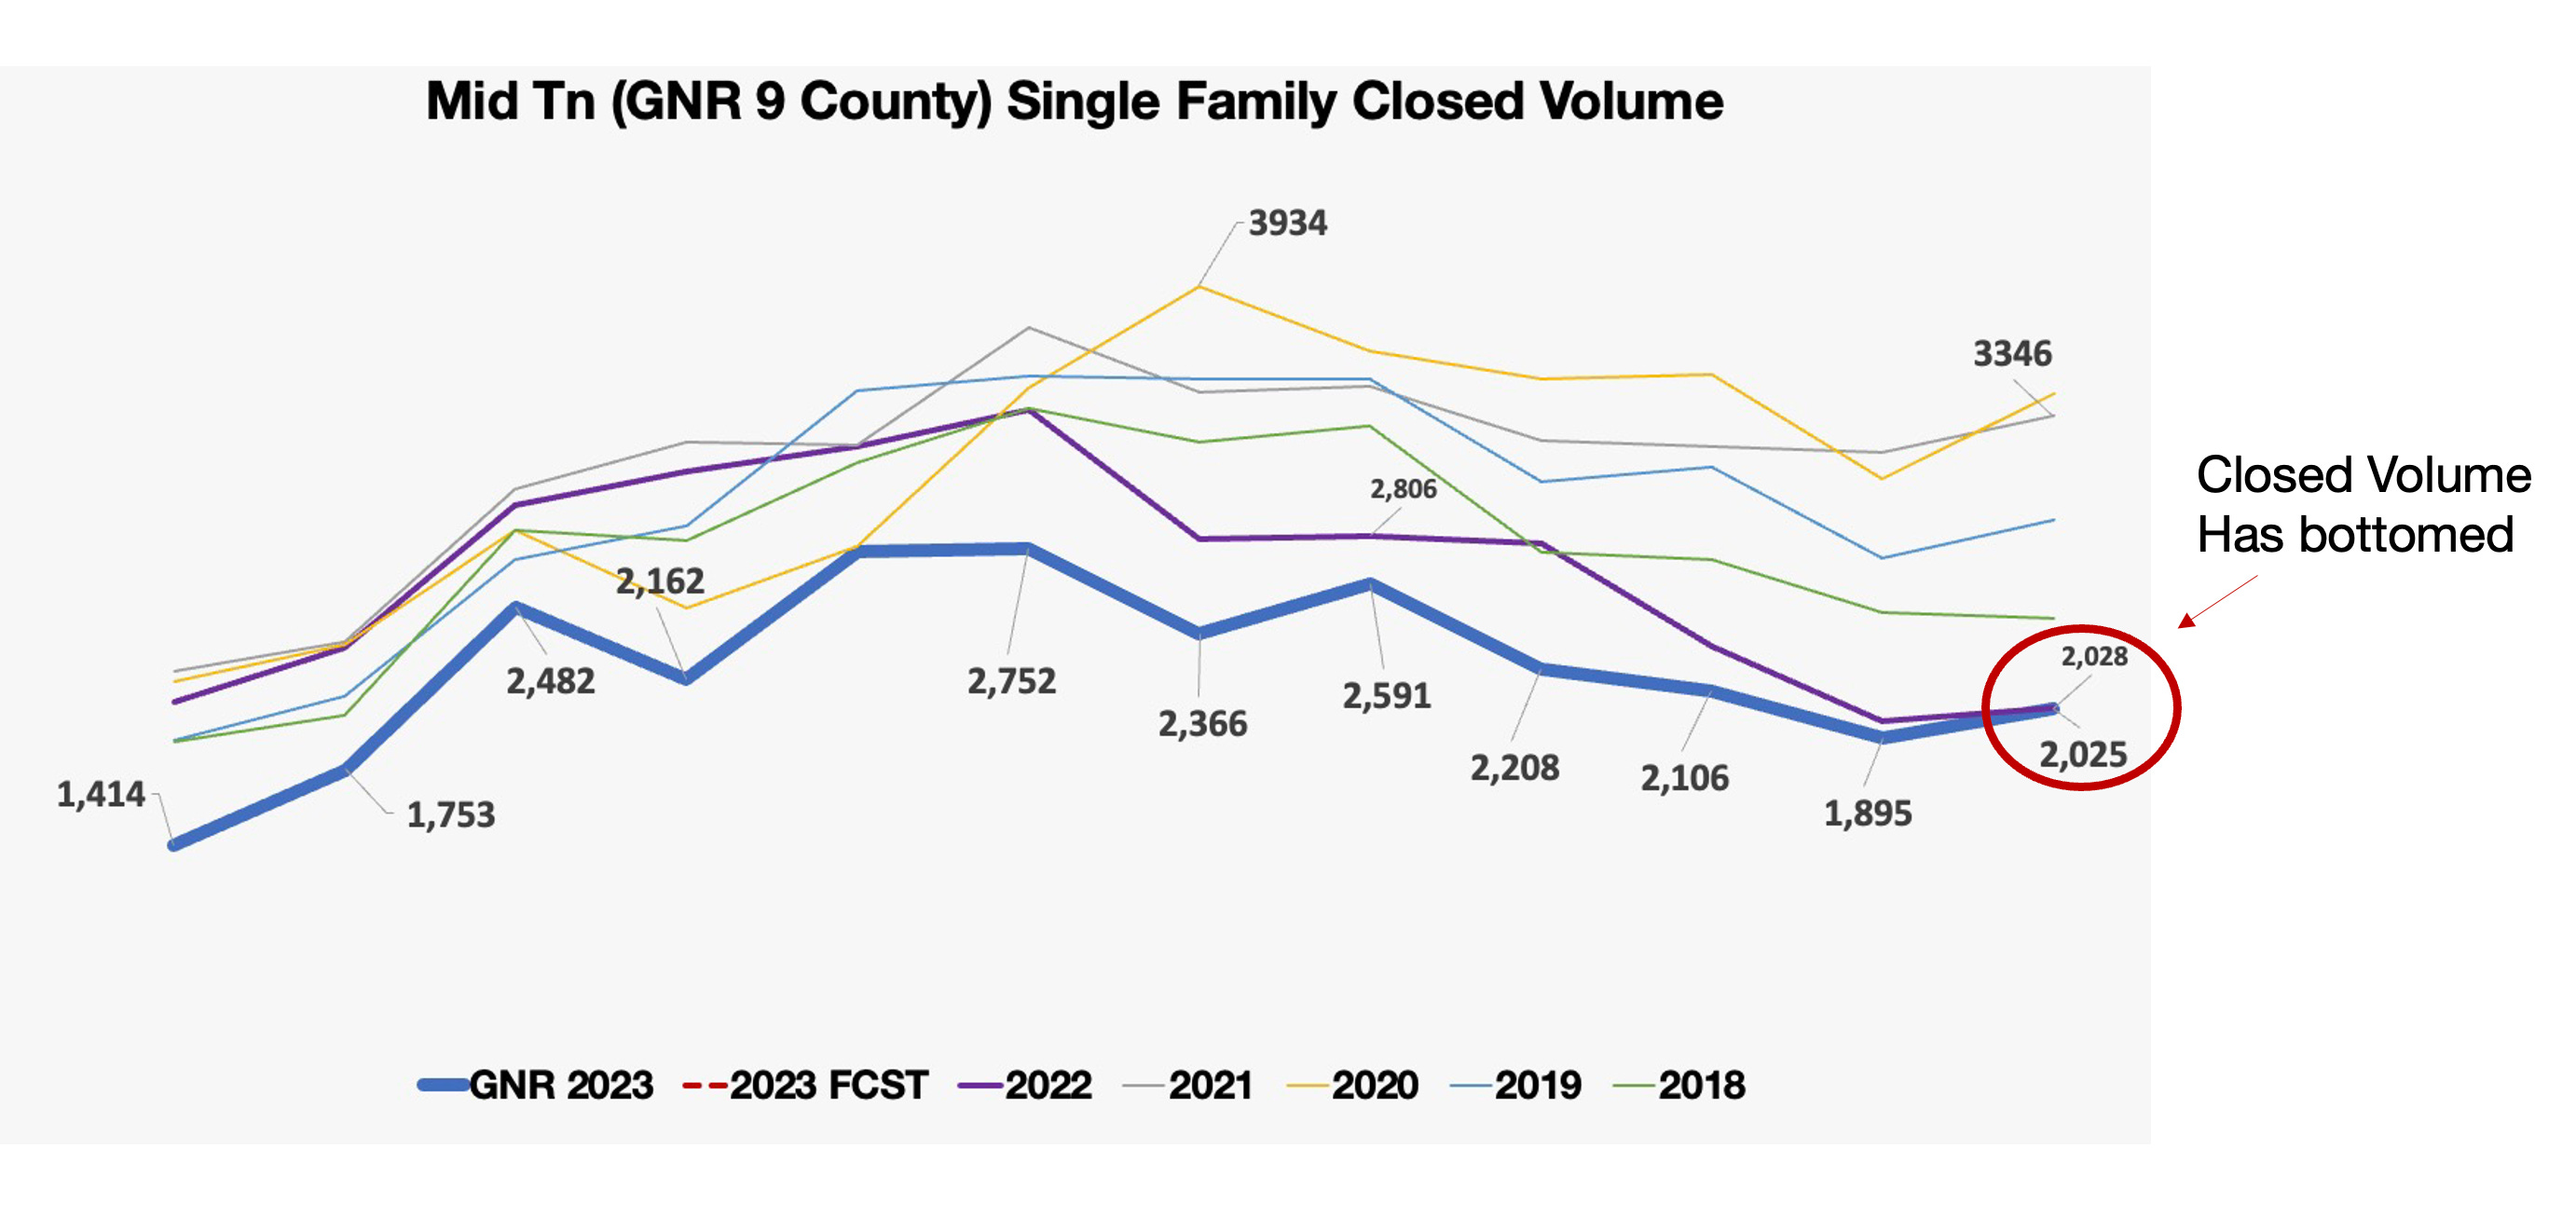
There’s also commentary about closed volume being down 15% for 2023. This is a brutal stat for 2023. But this is old news looking to 2024; closed volume just had it’s first flat month in well over a year and January looks to be positive YoY by ~10%.
The market is extremely hyper local, where some neighborhoods are seeing major buyers markets and other areas are in very tight sellers markets.
Here’s a few other interesting facts about the housing market:
Williamson County Single Family listings under $1M are down 25% YoY.
Williamson County $2M+ listings make up 28% of the active listings there.
33% of all Single Family Active Listings are New builds right now. 1802 New / 5,374 All
6% of Condos are listed over $1M vs 22% for Single Family in Greater Nashville
Thanks for reading! Updated Paid Subscriber Links Below (Assumable, New Build Listings Map, Days on Market heat map)
BTW I was featured in WKRN for helping the Benson family assume a mortgage. Exciting!